
Wazuh
Wazuh is a free and open-source security platform that unifies XDR (Extended Detection and Response) and SIEM (Security Information and Event Management) capabilities. It is designed to provide comprehensive threat prevention, detection, and response for workloads across on-premises, virtualized, containerized, and cloud environments. The platform operates using a central management server that collects, aggregates, and analyzes data from lightweight agents installed on monitored endpoints, such as laptops, servers, and cloud instances. This architecture allows security teams to gain deep visibility into their infrastructure and protect it from a wide range of cyber threats.
The core power of Wazuh lies in its extensive set of integrated security features. It performs real-time log data analysis, intrusion detection, and file integrity monitoring to identify suspicious activities and policy violations. The platform also includes robust vulnerability detection and security configuration assessment (SCA), which scan for known weaknesses and misconfigurations. By combining these capabilities with incident response actions and dashboards for regulatory compliance (such as PCI DSS, HIPAA, and GDPR), Wazuh provides a powerful, all-in-one solution for security operations and threat hunting.
My first introduction to Wazuh was an earlier version of Security Onion. At the time, I knew what it did for Security Onion, but I did not realize all of the features that the Wazuh platform by itself had. When I first installed it, I planned on using it as just a SIEM. Something that I could send logs to from my lab to get a better understanding of logs and incident identification.
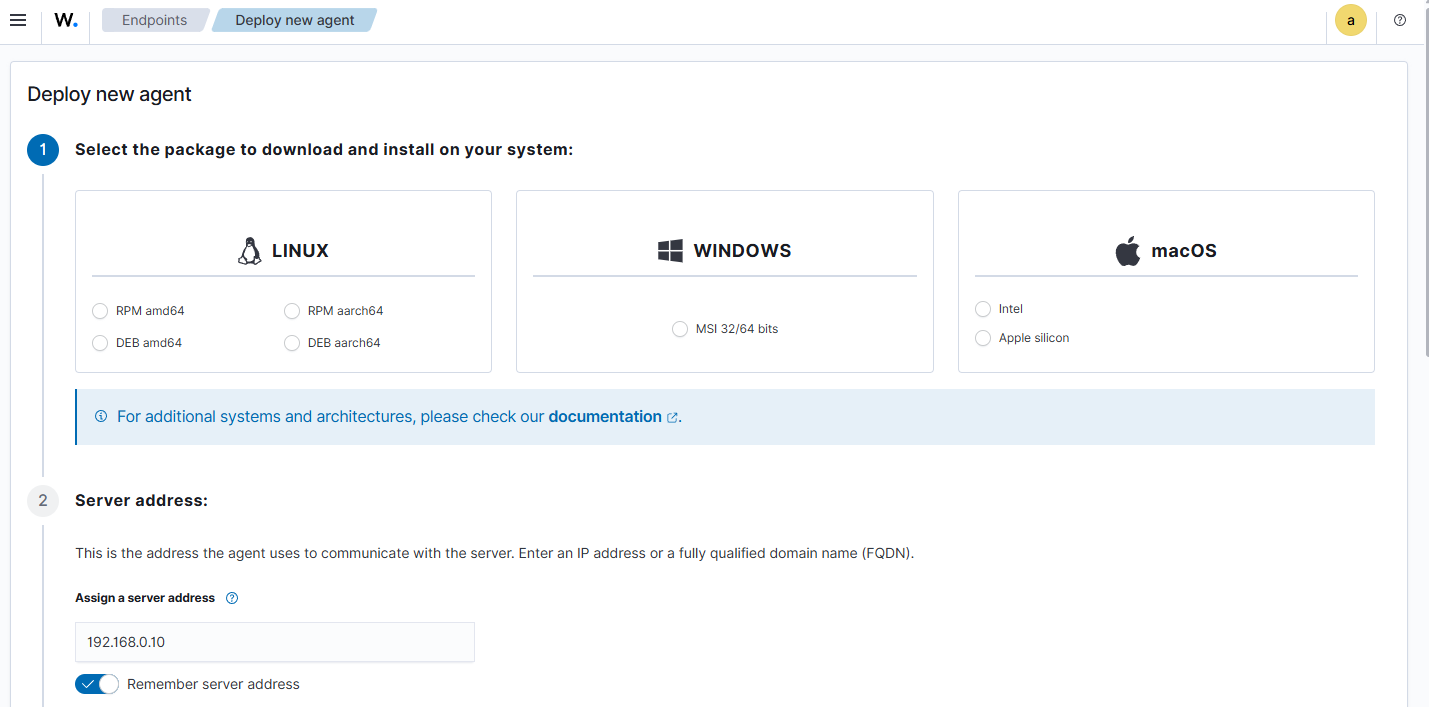
When I loaded the dashboard for the first time, it took me a minute to find the menu for adding agents, but once I did, it was a simple process to add more. Wazuh produces the commands for install on the operating system that you select and then you just copy and paste them into the host system.
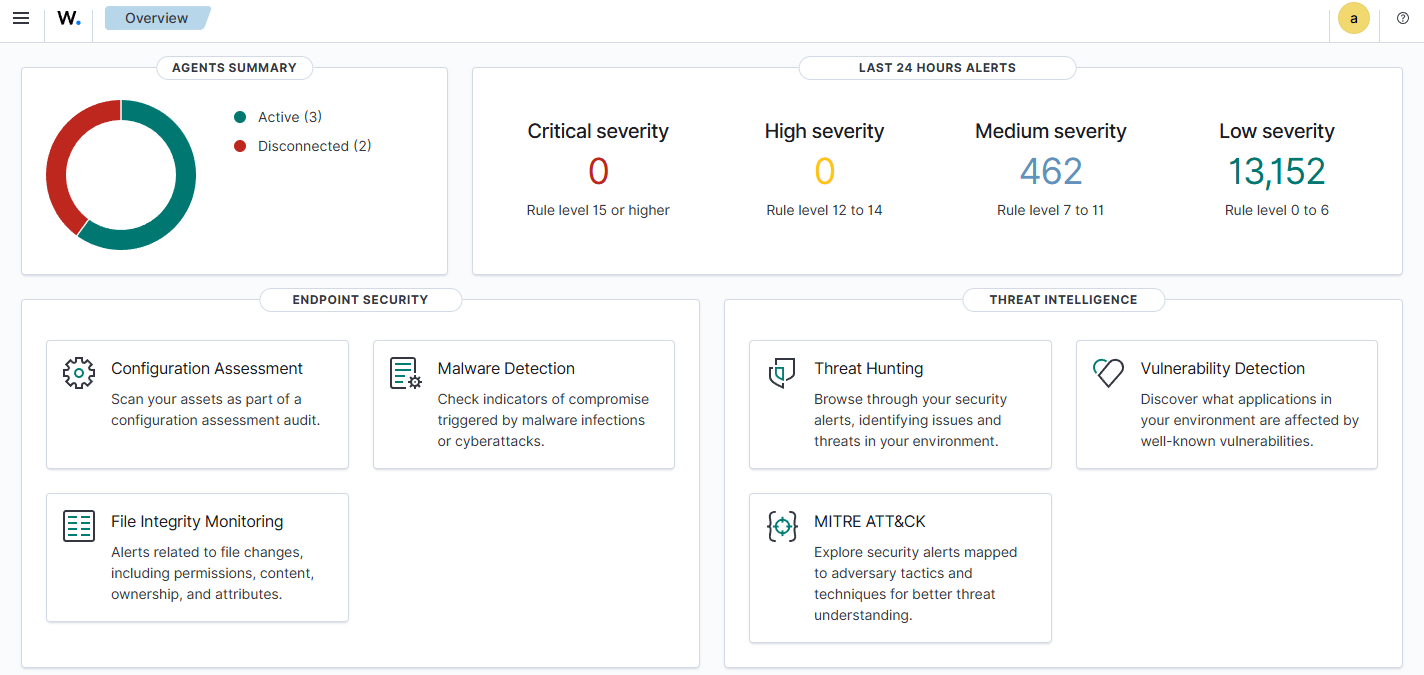
Once the agents are added, the overview dashboard begins to populate with information about alerts from the last 24 hours and display the agents connection status. It also has links to several other areas of the site.
The first thing that stood out to me was the Configuration Assessment. Since I wanted to learn not only how to secure systems, but also how to attack systems this was a great place for me to start. Once you select the agent that you want to view stats on it will run a series of test from the CIS Benchmarks for that operating system. I ran it against a Windows Server 2022 with a default configuration. This was a fresh install that was promoted to domain controller and had the file server feature added. I was surprised by the score.
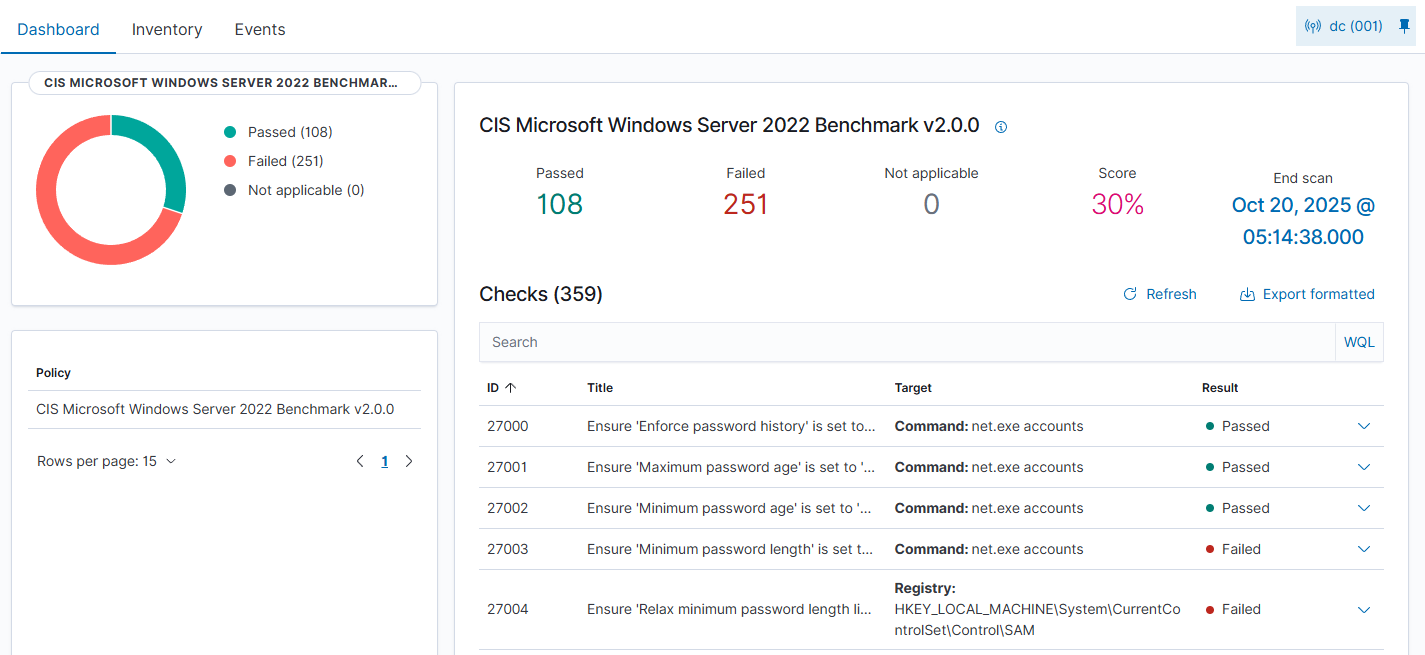
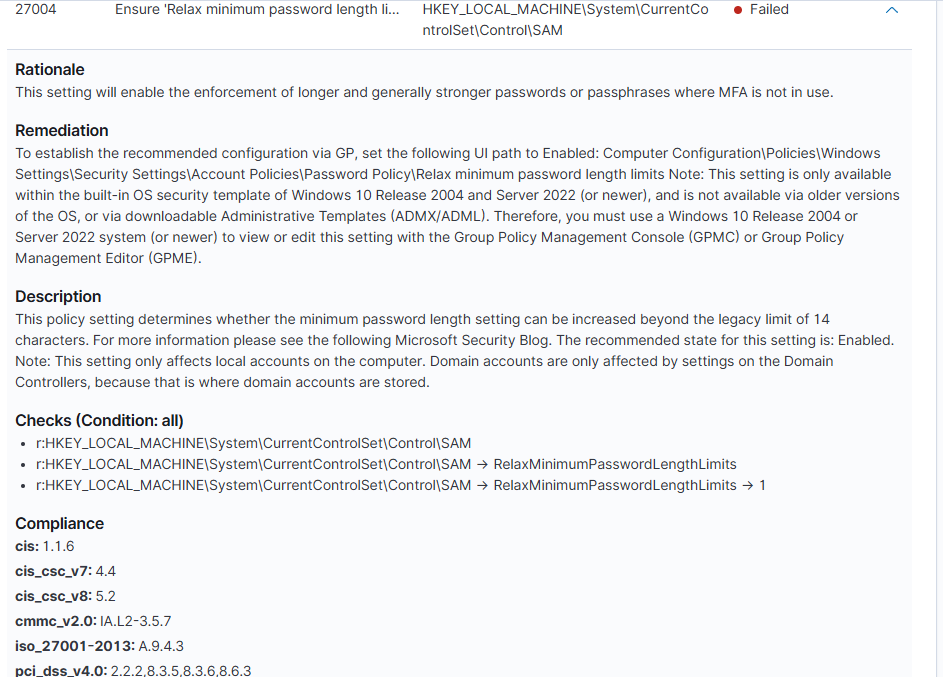
The default configuration only met 30% of the CIS benchmarks. I think that the most powerful feature of this screen is when you start looking into the individual checks themselves. Not only does it provide a description, but it details the reasoning behind the control and how to fix the misconfiguration.
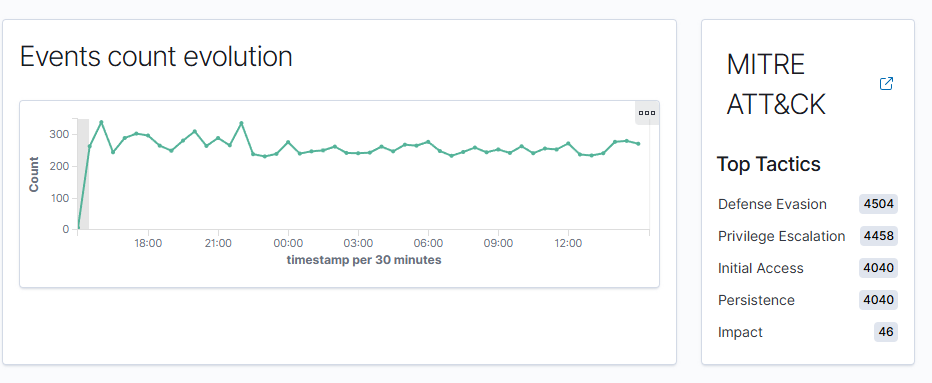
After running through a couple of the configuration, I wanted to see what else Wazuh could do. I went to the main dashboard for the same endpoint and found even more topics of interest. It displayed the event count for the endpoint, but it also mapped those events to the MITRE ATT&CK Framework.
Upon following the link for the MITRE Framework, I was met with even more information on a separate dashboard. Which displays a lot of information about how your endpoint logs correlate to the MITRE Framework.
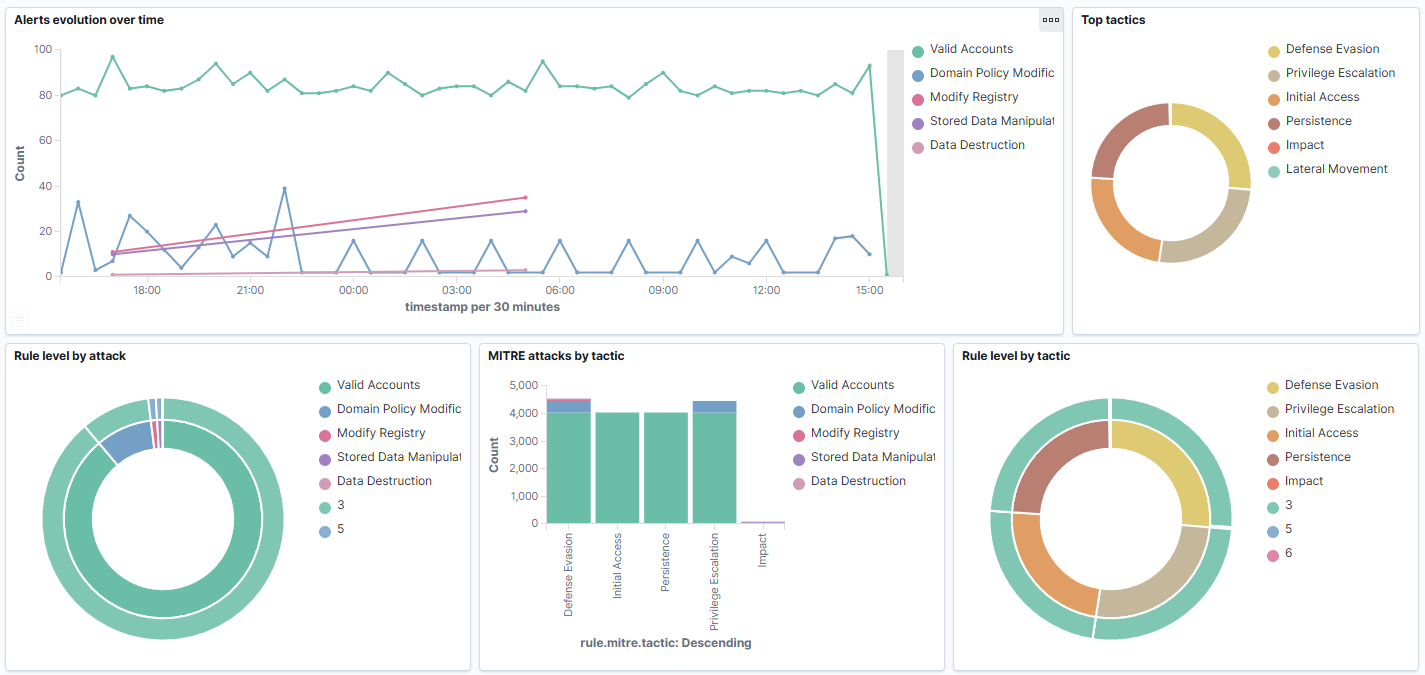
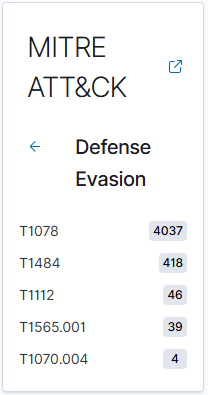
I found the real value by going back to the endpoint dashboard and clicking on the specific Tactic. For example Defense Evasion when clicked on produced another menu that mapped events to the specific node in the framework.
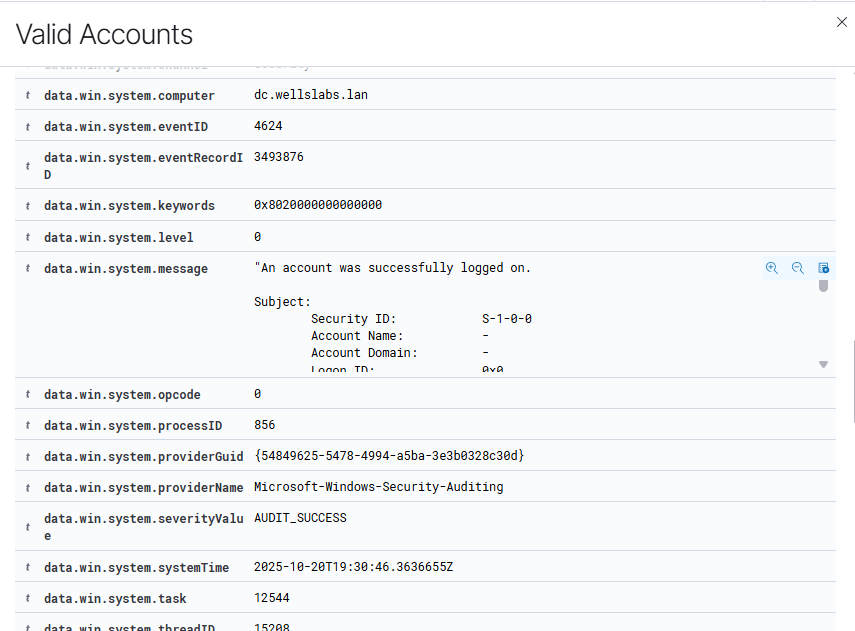
After clicking on the specific node here, I was presented with even more information about the actual event that triggered these nodes, including the actual Windows Event.
Then I went browsing into the File Integrity Monitoring dashboard for the same endpoint and was greeted with another display that quickly showed statistics.
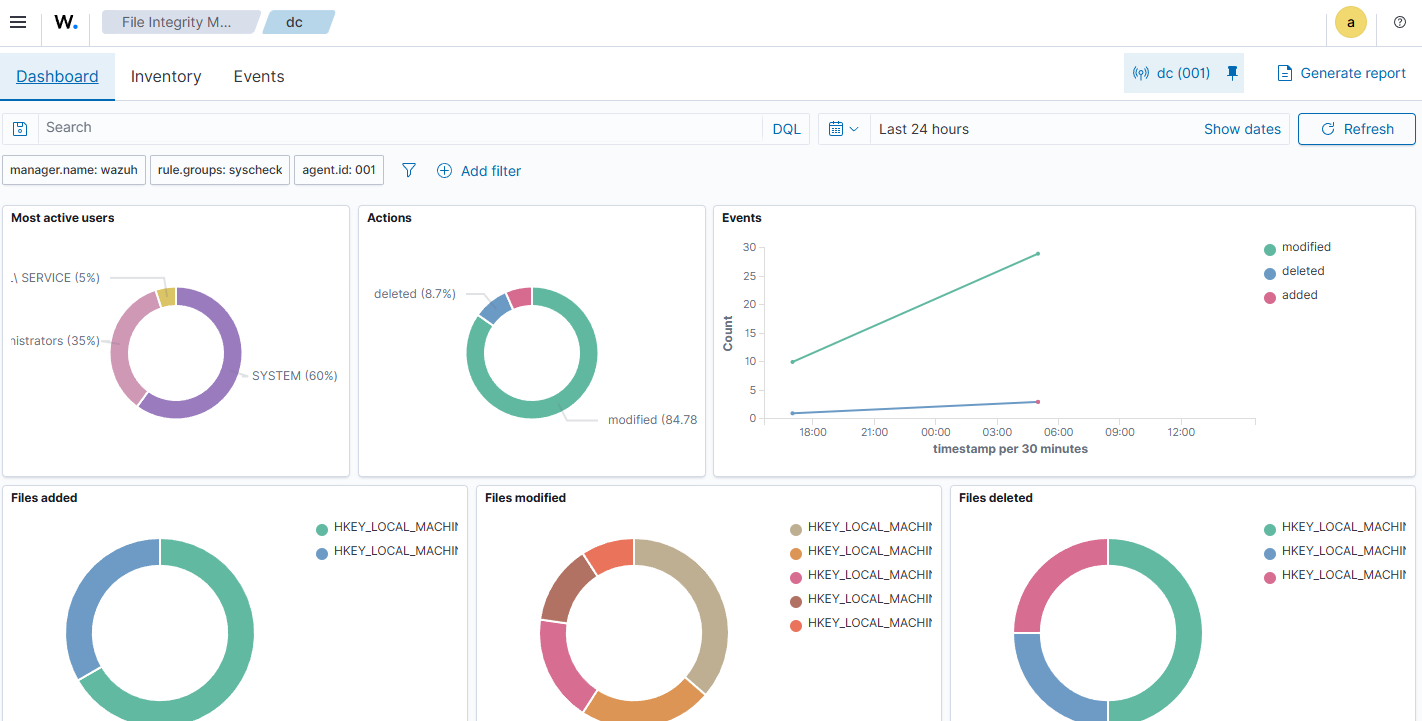
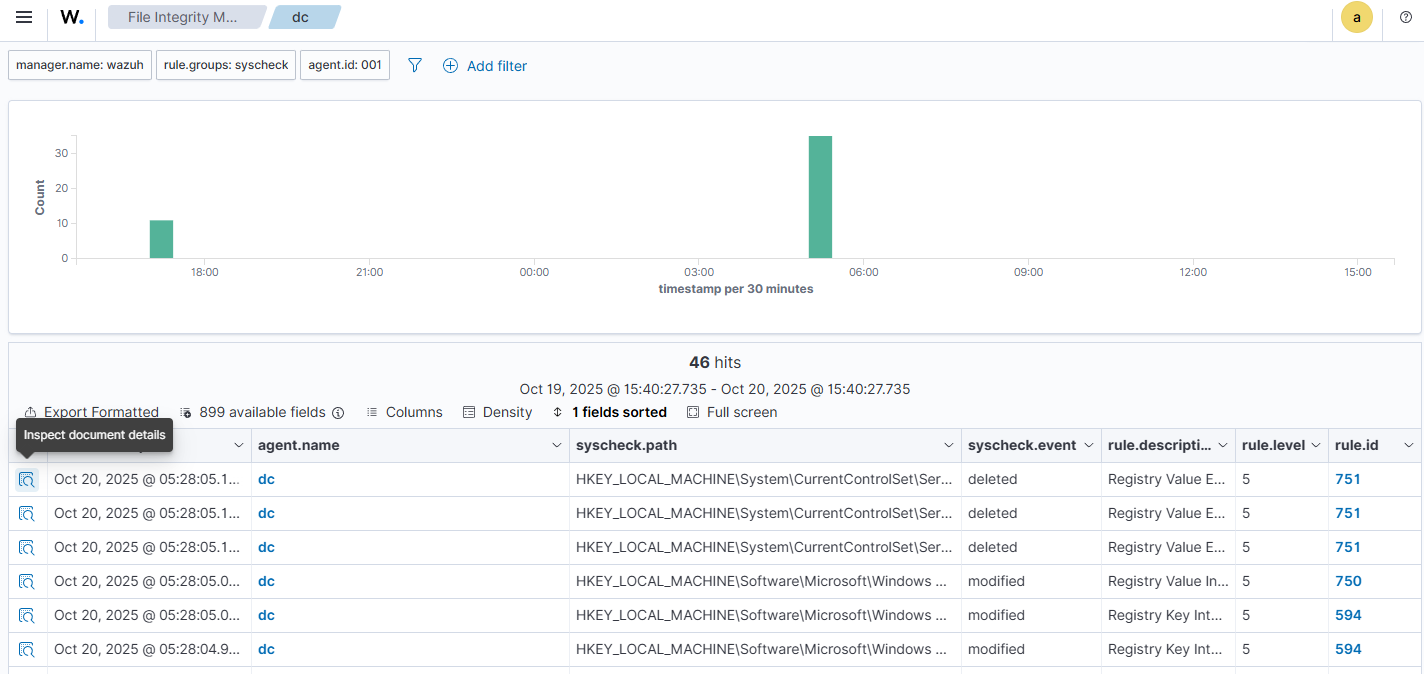
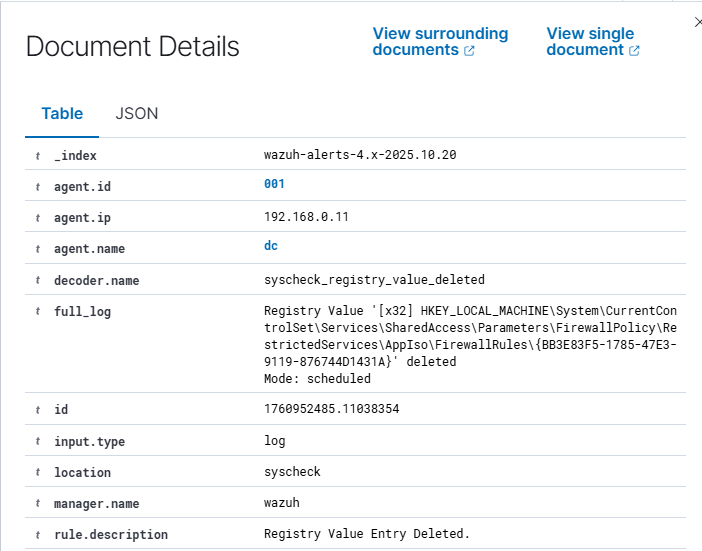
Going to the Events tab allowed me to see the events that were used to populate the dashboard and clicking on an individual event allowed me to see the relevant information for that event.
I was starting to see how powerful the Wazuh platform was now and I had not made it halfway through yet. The next section that I went to was the Vulnerability Detection dashboard for the same endpoint. Again, I was immediately greeted with a clear view of relevant information, including the number of vulnerabilities, the severity, and the top CVEs associated with these vulnerabilities.
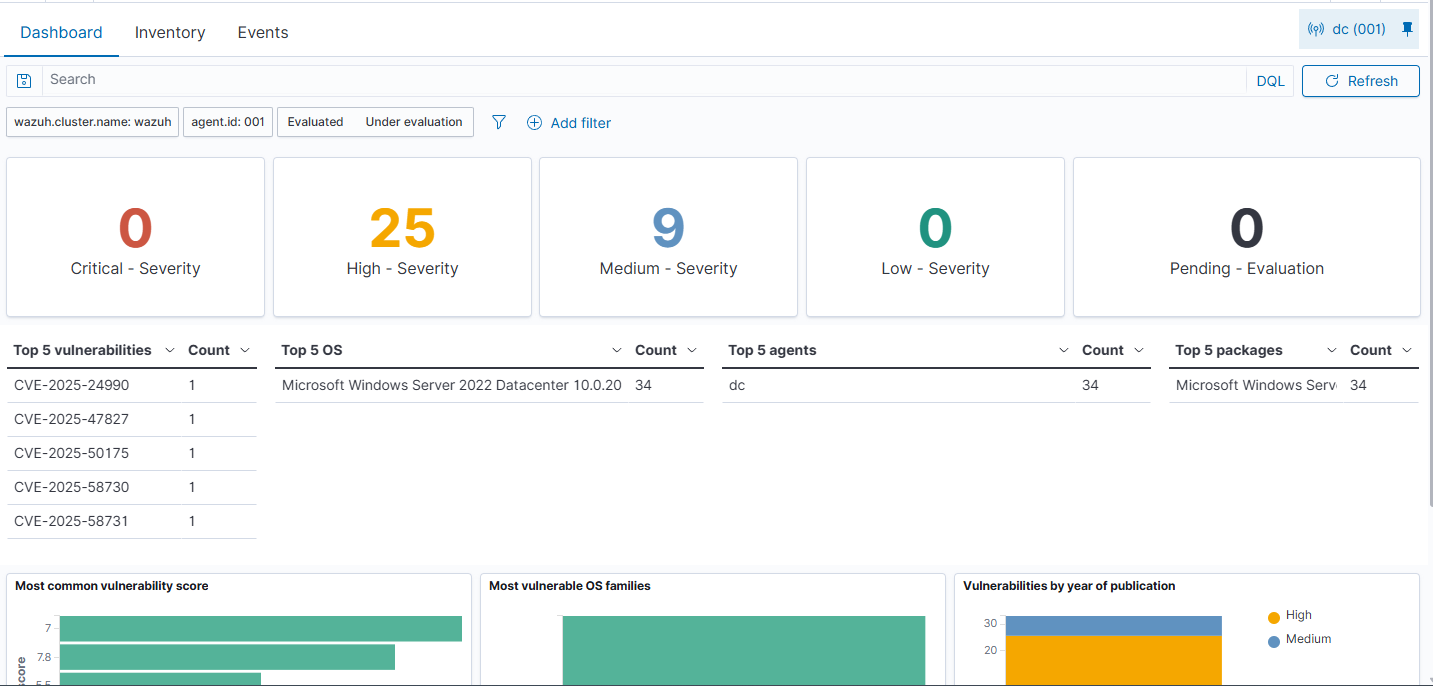
The inventory tab of this section provided me with a clear view of those vulnerabilities with a description and a link to the associated CVE.
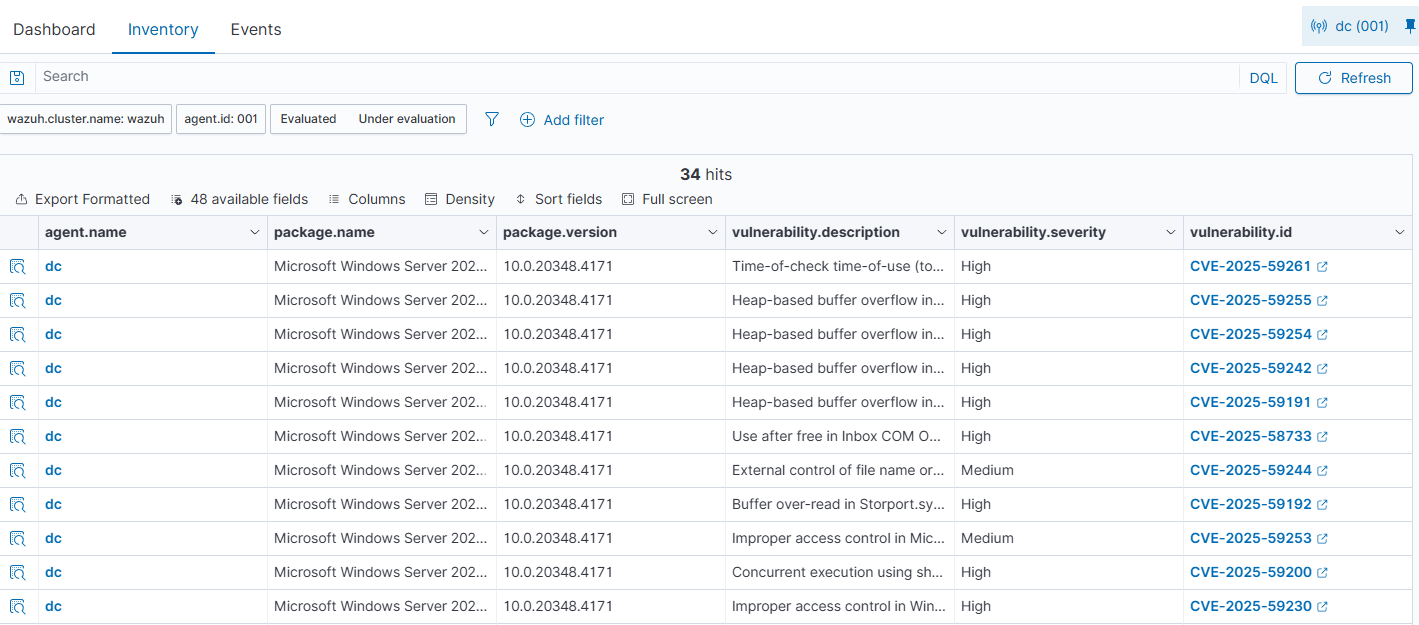
Most of these vulnerabilities were fixed in the most recent patch Tuesday from Microsoft, so a quick update of the server fixed them.
I had spent several hours learning this platform at this point and there is still so much more for me to learn. It also provides a way to interact with Docker and cloud environments such as AWS. All of the information that I discovered in Wazuh was all based on the default detection rules as well. I mature security team could use this platform and customize the rules and alerts to their organization.